Introduction
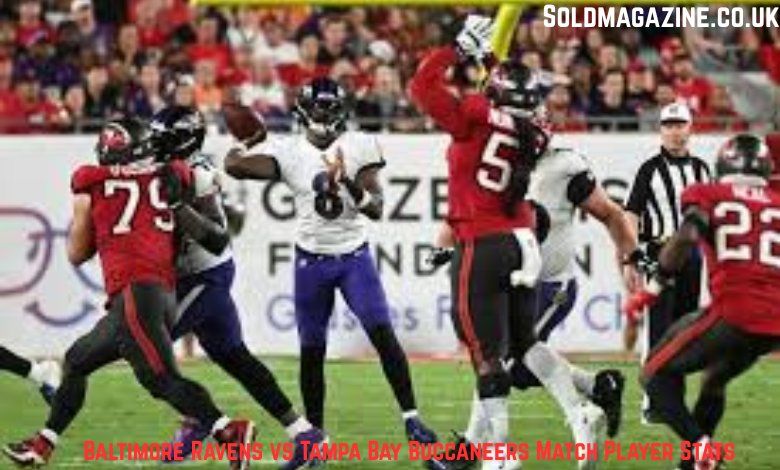
The Baltimore Ravens faced the Tampa Bay Buccaneers in a compelling NFL matchup, delivering a game full of significant statistics. With the Ravens coming out on top, 41-31, both teams showcased various strengths and weaknesses throughout the game. In this article, we’ll dive deep into the player statistics and team performance, offering insights into how these numbers shaped the result of the game.
Overview of the Matchup
The Baltimore Ravens entered this game with a solid 5-2 record, while the Tampa Bay Buccaneers were 4-3, making this a crucial matchup for both teams. The Ravens, performing well on the road with a 3-1 away record, were up against the Buccaneers, who had a balanced 2-2 home record. Despite the Buccaneers putting up a fight, the Ravens’ offensive efficiency and strong rushing game proved to be the difference. Baltimore ended up with a decisive 41 points, while the Buccaneers fell short with 31 points. Let’s break down how these stats unfolded.
Team Stats Breakdown
1. First Downs
- Baltimore Ravens: 22
- Tampa Bay Buccaneers: 28
The Buccaneers outpaced the Ravens in total first downs, but the Ravens made more efficient use of their opportunities, converting key plays to sustain drives and score more points.
2. Passing First Downs
- Baltimore Ravens: 12
- Tampa Bay Buccaneers: 19
Tampa Bay’s passing game was significantly more productive, as evidenced by their 19 passing first downs. This was partly due to the Buccaneers attempting more passes (45) compared to the Ravens’ 22 pass attempts. The Ravens compensated with an effective ground attack.
3. Rushing First Downs
- Baltimore Ravens: 7
- Tampa Bay Buccaneers: 7
Both teams were even in terms of rushing first downs, with each team converting 7. While the Ravens dominated on the ground in total rushing yards, both teams showed consistency in rushing for new sets of downs.
4. First Downs from Penalties
- Baltimore Ravens: 3
- Tampa Bay Buccaneers: 2
The Ravens benefitted from a few key penalties that gave them additional first downs, but this was not a major factor in the overall outcome.
5. 3rd Down Efficiency
- Baltimore Ravens: 3-8
- Tampa Bay Buccaneers: 11-17
Tampa Bay had a far superior 3rd down conversion rate, converting 11 of their 17 attempts (64%). In contrast, the Ravens struggled on 3rd down, converting just 3 out of 8 attempts (37.5%). Despite the Ravens’ lack of success on third downs, their excellent play calling and scoring efficiency kept them ahead.
6. 4th Down Efficiency
- Baltimore Ravens: 1-1
- Tampa Bay Buccaneers: 1-1
Both teams were perfect on 4th down attempts, converting 1 out of 1 each. This highlights their commitment to keep drives alive when needed, especially in key moments of the game.
7. Total Plays
- Baltimore Ravens: 54
- Tampa Bay Buccaneers: 78
Tampa Bay ran 24 more plays than Baltimore, showing their offensive dominance in terms of time spent on the field. However, despite running more plays, the Buccaneers failed to capitalize on their possession advantage.
8. Total Yards
- Baltimore Ravens: 508
- Tampa Bay Buccaneers: 481
Although Tampa Bay had fewer yards overall, their passing game contributed significantly to their total yardage. The Ravens, on the other hand, outpaced the Buccaneers in both passing and rushing yardage.
9. Total Drives
- Baltimore Ravens: 10
- Tampa Bay Buccaneers: 12
Tampa Bay had two more drives than the Ravens, which allowed them to attempt more plays and score more points. However, the Ravens made better use of their opportunities, scoring efficiently and limiting their turnovers.
10. Yards Per Play
- Baltimore Ravens: 9.4
- Tampa Bay Buccaneers: 6.2
The Ravens had a much more efficient offense, averaging 9.4 yards per play compared to Tampa Bay’s 6.2 yards per play. This was a clear indication of how explosive the Ravens’ offense was, especially in key situations.
Offensive Stats Comparison
11. Passing
- Baltimore Ravens Passing Yards: 264
- Tampa Bay Buccaneers Passing Yards: 356
Despite Baltimore’s balanced attack, the Buccaneers passed for 92 more yards, largely due to quarterback Tom Brady attempting 45 passes. Brady had a higher completion rate (31 completions out of 45 attempts) compared to the Ravens’ Lamar Jackson (17 completions out of 22 attempts). However, the Ravens’ passing game was more efficient, gaining an average of 11 yards per pass.
12. Comp/Att
- Baltimore Ravens: 17/22
- Tampa Bay Buccaneers: 31/45
While Brady threw more passes, Lamar Jackson was more efficient with his completions, and this played a significant role in Baltimore’s victory. Jackson’s ability to strike downfield and then shift to the ground game was key to their success.
13. Yards Per Pass
- Baltimore Ravens: 11.0
- Tampa Bay Buccaneers: 7.4
The Ravens had a much higher average yardage per pass attempt, which highlights their explosive passing plays. Jackson made several key throws downfield that resulted in substantial gains.
14. Interceptions Thrown
- Baltimore Ravens: 0
- Tampa Bay Buccaneers: 2
The Ravens managed to avoid interceptions, while Brady was picked off twice. The turnovers were critical in the context of the game, as the Ravens capitalized on both of those interceptions, leading to more scoring opportunities.
15. Sacks and Yards Lost
- Baltimore Ravens: 2-17
- Tampa Bay Buccaneers: 3-14
Both teams’ defenses got to the quarterback, but the Ravens’ defense was slightly more effective in terms of yardage lost due to sacks.
Rushing Stats Breakdown
16. Rushing Yards
- Baltimore Ravens Rushing Yards: 244
- Tampa Bay Buccaneers Rushing Yards: 125
The Ravens dominated the ground game, rushing for 244 yards, far outpacing the Buccaneers’ 125 yards. Baltimore’s running back corps, led by Jackson, was exceptionally productive, averaging 8.1 yards per rush.
17. Rushing Attempts
- Baltimore Ravens: 30
- Tampa Bay Buccaneers: 30
Both teams had an equal number of rushing attempts, but the Ravens’ ability to gain significantly more yardage per rush (8.1 yards compared to Tampa Bay’s 4.2) demonstrated their superior running game.
18. Yards Per Rush
- Baltimore Ravens: 8.1
- Tampa Bay Buccaneers: 4.2
The Ravens averaged more than double the yards per rush compared to the Buccaneers. This was a significant factor in their ability to sustain drives and control the clock.
Red Zone and Turnovers
19. Red Zone Conversions
- Baltimore Ravens: 4-5
- Tampa Bay Buccaneers: 3-5
The Ravens were efficient in the red zone, converting 4 of their 5 red zone opportunities into touchdowns. The Buccaneers, meanwhile, were less effective, scoring on only 3 of their 5 red zone chances.
20. Turnovers
- Baltimore Ravens: 1
- Tampa Bay Buccaneers: 2
Baltimore’s ability to limit their turnovers to just one, compared to the Buccaneers’ two, was a significant factor in their success. The Ravens capitalized on the turnovers, converting them into scoring opportunities.
21. Penalties
- Baltimore Ravens: 9-85
- Tampa Bay Buccaneers: 8-75
Both teams committed a similar number of penalties, but the Ravens’ penalties cost them 85 yards, whereas the Buccaneers gave up 75 yards. Although both teams had penalty issues, it didn’t significantly affect the outcome of the game.
Possession Time
22. Possession
- Baltimore Ravens: 24:55
- Tampa Bay Buccaneers: 35:05
Despite the Ravens scoring more points, the Buccaneers had a much longer possession time, holding the ball for over 35 minutes. This time advantage allowed Tampa Bay to run more plays, but the Ravens’ efficiency and explosive plays ultimately won the game.
Conclusion
In a matchup where both teams displayed impressive offensive and defensive play, the Baltimore Ravens emerged victorious over the Tampa Bay Buccaneers, 41-31. The game was a tale of efficiency versus volume, with the Ravens’ ability to capitalize on their limited opportunities proving to be the difference. While the Buccaneers had more total yards, more passing attempts, and held the ball for longer periods, the Ravens’ balanced attack, explosive passing game, and powerful rushing attack allowed them to put up 41 points. Their defense, despite allowing 356 passing yards, forced two key interceptions, further sealing their win. This game showcased the importance of efficiency, both in terms of offensive production and turnover management. The Ravens, through their consistent offensive output and defensive stops, were able to outlast the Buccaneers, securing a crucial win on the road.
FAQS
1. Who won the Baltimore Ravens vs Tampa Bay Buccaneers match?
The Baltimore Ravens secured a 41-31 victory.
2. How many total yards did the Ravens have in the game?
The Ravens totaled 508 yards in the game.
3. What was the Ravens’ rushing yards total?
The Ravens rushed for 244 yards in the game.
4. Did Lamar Jackson throw any interceptions?
No, Lamar Jackson did not throw any interceptions.
5. How many sacks did the Ravens’ defense record?
The Ravens’ defense recorded 2 sacks in the game.