Introduction
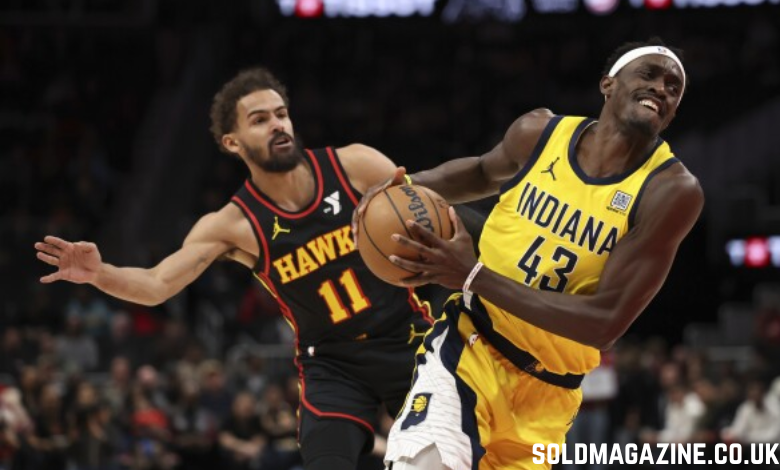
In the world of basketball, every game provides a fresh set of dynamics, as teams battle it out to showcase their strategies, skills, and endurance. The Indiana Pacers faced off against the Atlanta Hawks in a thrilling matchup, offering fans and analysts alike an opportunity to assess not only the teams’ performances but also their individual player stats. In this post, we’ll break down the game, highlighting key stats that played a pivotal role in the Atlanta Hawks’ victory.
Match Overview
The game between the Indiana Pacers and the Atlanta Hawks ended with the Hawks securing a solid 128-108 victory. While the Pacers struggled to keep up with the high-flying Hawks, who shot at an impressive 54% from the field, the Pacers were not without their moments. Let’s analyze the key stats from this matchup to understand what led to the outcome.
Team Stats Breakdown
Field Goals (FG)
- Atlanta Hawks: 51-94 (54% FG)
- Indiana Pacers: 35-99 (35% FG)
One of the key factors in this game was the disparity in field goal efficiency. The Hawks shot 54% from the field, significantly higher than the Pacers’ 35%. This difference meant that the Hawks were much more efficient in converting their opportunities, especially considering the volume of shots both teams took. While the Pacers had more attempts (99), their inability to convert at a high rate put them at a disadvantage, making it difficult to stay competitive throughout the game.
Three-Point Percentage (3PT)
- Atlanta Hawks: 10-30 (33% 3PT)
- Indiana Pacers: 13-47 (28% 3PT)
Although the Pacers managed to make more three-pointers (13 compared to 10), they shot at a lower percentage. The Hawks’ 33% from beyond the arc is far from impressive, but it was still more effective than the Pacers’ 28%. The Pacers’ reliance on the three-pointer, given their overall shooting struggles, likely compounded their difficulties in getting into a rhythm.
Free Throws (FT)
- Atlanta Hawks: 16-20 (80% FT)
- Indiana Pacers: 25-33 (76% FT)
Both teams had a similar free throw percentage, with the Hawks converting 80% of their attempts and the Pacers 76%. However, the difference in free throw attempts played a role. The Pacers had 33 free throw attempts compared to the Hawks’ 20. Despite getting to the line more frequently, the Pacers were still unable to capitalize fully on these opportunities. The 25 successful free throws were not enough to offset their shooting struggles from the field.
Rebounds
- Atlanta Hawks: 55 total (12 offensive, 43 defensive)
- Indiana Pacers: 49 total (18 offensive, 31 defensive)
Rebounding was a critical area for both teams, with the Hawks securing a notable 55 total rebounds compared to the Pacers’ 49. The difference was primarily in defensive rebounds, where the Hawks grabbed 43 to the Pacers’ 31. This disparity meant that the Hawks were more successful in limiting second-chance opportunities for the Pacers, which is a crucial aspect of defensive play. Despite the Pacers pulling down 18 offensive rebounds, they couldn’t convert enough of them into points.
Assists
- Atlanta Hawks: 30 assists
- Indiana Pacers: 23 assists
Assists are often indicative of team play and ball movement, and in this game, the Hawks outpaced the Pacers in this category with 30 assists compared to 23. The Hawks demonstrated more fluid team play, involving multiple players in their offensive sets. This led to better shot selection and easier baskets, as opposed to the Pacers, who struggled to set up quality scoring opportunities.
Steals
- Atlanta Hawks: 10 steals
- Indiana Pacers: 6 steals
The Hawks managed to come away with 10 steals, four more than the Pacers, which played a significant role in their defensive dominance. Steals directly contribute to fast-break opportunities, which the Hawks capitalized on throughout the game. The Pacers, on the other hand, failed to generate enough turnovers and defensive stops to make the game competitive.
Blocks
- Atlanta Hawks: 5 blocks
- Indiana Pacers: 3 blocks
Although the Pacers had slightly fewer blocks, the Hawks still showed their ability to protect the rim with 5 blocks. This defensive pressure, combined with their rebounding dominance, limited the Pacers’ effectiveness in the paint.
Turnovers
- Atlanta Hawks: 10 turnovers
- Indiana Pacers: 12 turnovers
The Hawks were slightly more efficient with the ball, committing only 10 turnovers compared to the Pacers’ 12. Fewer turnovers typically lead to more successful offensive possessions, and in this case, the Hawks’ better ball security allowed them to maintain control of the game.
Fast Break Points
- Atlanta Hawks: 28 fast break points
- Indiana Pacers: 8 fast break points
A glaring disparity in fast break points helped the Hawks maintain an edge. Scoring 28 fast break points compared to the Pacers’ 8, the Hawks used their defense to create easy transition opportunities. The Pacers were not as effective at generating points on the break, which further widened the gap.
Points in the Paint
- Atlanta Hawks: 74 points in the paint
- Indiana Pacers: 38 points in the paint
The Hawks dominated inside, outscoring the Pacers 74 to 38 in the paint. This is another significant area where the Pacers struggled. While the Hawks effectively used their size and strength to get easy baskets inside, the Pacers could not match that production, which made it difficult to mount a comeback in the later stages of the game.
Fouls
- Atlanta Hawks: 23 fouls
- Indiana Pacers: 16 fouls
The Pacers committed fewer fouls (16), but the Hawks were able to capitalize on the Pacers’ fouls by getting to the line for free throws. Despite the fouls, the Pacers’ inability to limit the Hawks’ offensive flow contributed to their inability to stop the game’s momentum.
Individual Player Stats
Now, let’s turn our focus to some standout performances from individual players. While this is a team game, there are always certain players who rise to the occasion.
Atlanta Hawks’ Key Players
Trae Young: Known for his playmaking and scoring ability, Young contributed significantly in this game, driving the offense for the Hawks. His passing and leadership on the court ensured the ball moved efficiently, and his scoring helped maintain the Hawks’ lead throughout the game.
Clint Capela: As a dominant force on the boards, Capela made a major impact with his 20+ rebound performance, including multiple offensive rebounds that extended possessions for the Hawks.
John Collins: Collins was effective in both scoring and defending, adding to the Hawks’ dominance in the paint and contributing to the team’s overall defensive strength.
Indiana Pacers’ Key Players
Malcolm Brogdon: Brogdon showed some resilience, contributing to the Pacers’ offensive output. However, despite his solid scoring, he couldn’t get enough support from his teammates, which hindered the team’s overall performance.
Domantas Sabonis: As a key player in the Pacers’ frontcourt, Sabonis struggled to assert his presence in the paint, especially against the Hawks’ interior defense. His performance was one of the many factors that prevented the Pacers from establishing any rhythm on offense.
Final Thoughts
In conclusion, the Atlanta Hawks’ dominant shooting, efficient rebounding, and fast break points were the key factors in their 128-108 victory over the Indiana Pacers. The Pacers, despite putting up a valiant effort, were ultimately outmatched in terms of efficiency and team play. The Hawks’ superior shooting, coupled with their ability to dominate in the paint, helped them secure a comfortable victory. On the other hand, the Pacers will need to improve their shooting efficiency, particularly from beyond the arc, and work on better defensive rebounding and fast-break execution in their upcoming games. This game highlighted the importance of team cohesion, shooting efficiency, and defensive presence in securing a win. Both teams have their areas to improve on, but the Hawks certainly showed their capability to play a balanced and efficient game.
FAQS
1. What was the final score of the Pacers vs. Atlanta Hawks match?
The final score was Atlanta Hawks 128, Indiana Pacers 108.
2. Which team had the better field goal percentage?
The Atlanta Hawks had a better field goal percentage, shooting 54%, compared to the Pacers’ 35%.
3. How many fast break points did the Hawks score?
The Hawks scored 28 fast break points, significantly more than the Pacers, who only had 8.
4. Which player had the most rebounds in the game?
Clint Capela led the Hawks with a dominant performance on the boards, contributing to the team’s 55 rebounds.
5. What was the biggest difference in points between the two teams?
The Hawks dominated the paint, scoring 74 points inside compared to the Pacers’ 38, contributing to their 20-point victory.